 |
| Who knew Delorean's topped out at 88 MPH... |
First, let's set the stage by defining a set of business questions we want to answer with our analysis. Let's say we want to see what kind of patterns are in our event data across the hours in a business day. And see if those patterns are consistent across days, months, years. Let's say we're trying to understand our peak hours versus our slow times to help with capacity planning, scheduling, etc. This will give us a good goal to work towards.
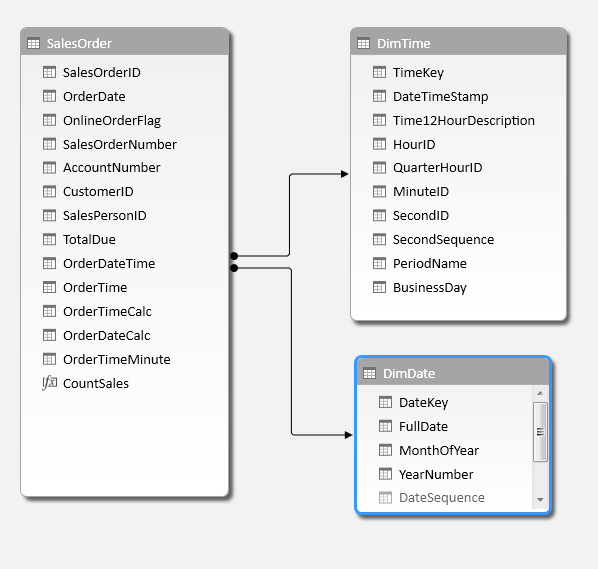
Now for this exercise, we need a model that will allow us to slice by date, as well as time, to see these patterns. Here's the basic dimensional model that we'll build to address the questions above.

I tried a few different approaches, and the one I settled on was this: Make the assumption (for this example) that each customer shops at the same time everyday. Given that, I multiplied each customer's CustomerID by 10, and then added that many seconds to 00:00 time. Then combine that with the OrderDate of the customer's orders. Not the best solution, but it works out to produce a nicely distributed dataset. The altered OrderDate SQL we'll work from is calculated as:
DATEADD(second,(CustomerID * 10),[OrderDate])
Now, with the source datetimestamp in place, we'll need to define a date column and a time column in our Sales table that we can join to the date dimension and time dimension respectively.
Calculated Column Solution:
One way to do this is to simply bring the raw datetime into your PowerPivot / Tabular model, and then create calculated columns with DAX to break apart the time and date. The DAX for the Time column would be:
=TIME(HOUR([OrderDateTime]),MINUTE([OrderDateTime]),SECOND([OrderDateTime]))
And the DAX for the date column would be:
=DATE(YEAR([OrderDateTime]),MONTH([OrderDateTime]),DAY([OrderDateTime]))
Technically this works. You get the grain right (seconds) with minimal effort. And you get the '1899-12-30' base date by default without having to do anything special. The downside of this approach, as I mentioned in the previous post, is that you waste precious memory loading the raw datetime source field that you likely won't even use in your analysis. This field typically has a unique value on every row, so the Vertipaq compression algorithms won't be as effective on these compared to splitting the date from the time in the source query. For small datasets where optimization isn't that important, feel free to stop here.
Datasource Query Solution:
On larger datasets, and when optimization and query speed are critical, there's a better approach we can explore. It involves splitting the source datetimestamp into separate date and time columns in the source query. This is the approach I mentioned in my prior post that Webb, Russo and Ferrari touched on in the tuning section of their book on AS Tabular.
To accomplish this splitting, we use some date manipulation in our source query SQL. The date part is pretty straight forward so let's knock that out first.
We need a simple date with zeros for the time component. I originally tried to just convert the OrderDate from Datetime to Date datatype (yyyy-MM-dd) to get rid of the seconds. Unfortunately, PowerPivot imported the Date datatype as text. So to avoid that, I simply casted back to datetime in my source query. Like this:
CONVERT(datetime, CONVERT(date, DATEADD(second,(CustomerID * 10),[OrderDate])))
Now for the time component. We need a timestamp with the desired '1899-12-30' base date to match up with our Time dimension. The main challenge to address here (and one that may not be immediately obvious) is matching up the granularity of the event time data with the grain of our Time dimension. For now, we'll stick with the grain I defined in the last post: seconds in a 24 hour period.
The source field for our timestamp (SalesOrderHeader.OrderDate) is Datetime datatype (yyyy-MM-dd hh:mm:ss.000). Since we are adding whole seconds to tweak our AW source, technically, we could get away without addressing milliseconds directly. But in the real world, when you're dealing with timestamps, they'll typically have full precision (milliseconds or lower depending on the datatype or source). And you'll need a technique to round off to seconds in order to be able to get a perfect match between each event datetimestamp and your Time dimension.
Several ways to do this. The simplest way I came up with was to convert the source data's date to a time datatype (this truncates the date component), then cast to Datetime2 with zero precision (i.e., no milliseconds - just truncate them). This gives us the time with the default zero date (1900-01-01). Like this:
CONVERT(datetime2(0),(CONVERT(time,DATEADD(second,(CustomerID * 10),[OrderDate]))))
The last little twist is that we need to get the base date of '1899-12-30' that our Time dimension has. For that, we just need to subtract 2 days from the zero date like this:
DATEADD(day,-2,CONVERT(datetime2(0),CONVERT(time,DATEADD(second,(CustomerID*10),[OrderDate]))))
With that, we've got the 2 date parts we need to build our model. After loading the SalesOrder, Date and Time tables, just define relationships between the OrderDate and OrderTime (from SalesOrder to DimDate and DimTime). With that, we've created this model:
With that, let's focus on answering the questions in our time analysis.
To see the distribution of Sales events across dates and across the times of day, we can create a simple pivot chart and table off our model like this:

Here, I'm slicing by the hour buckets (4 hour blocks) across months. And I've added some conditional formatting in the pivot table below the chart to high-light the time blocks with the most sales.
This let's us see pretty clearly that mid-morning is the busiest time block, while all other periods are relatively busy as well. Also see a sharp rise ins sales in summer 2007 which we could focus in on and look more closely at. None of the 4 hour blocks are completely dead, so no clear downtime for our staffing / retooling question. Apparently Adventure Works is killin it around the clock :-D. Anyway, we can easily slice by different time buckets and filter down to just certain years or months to explore different patterns in the data. Lot of directions you can go with this.
That's it for now. Here's a link to the workbook (2013 version) with the model for reference. I'll build this out a bit more with some more bells and whistles in my next post.
Hey there!
ReplyDeleteGreat post and something I'm very interested in. I've got my TimeDim done and it works well. However, now I'm down to a problem that use to be easy to handle in normal AS.
The Month Names at my month level are out of order because as usual it's trying to do it alphabetically. How do you sort your dimension levels in a Tabular model? There use to be a 'Sort By' property for levels in AS Dimensions but I haven't found an equivalent in Tabular.
Thanks for your time and please keep the posts coming.
V
Hi Voorshwa - Glad you like the post.
DeleteFor sorting month names by their number, there's a "Sort By Column" property that you can set on each column in a Tabular model. You can reference another column within the same table. Set this directly in the properties pane ("Sort By Column"). Or from the drop down menus, with a single column header selected in the data view, select the "Column" menu -> Sort -> Sort by Column. That will pop up a form to select the sorting column.
Let me know if that helps.
Brent
Brent great post. I was trying to download the excel sample, and it appears to be more than 5 meg. Not allowed by the live account.. Any way you could edit the post to show some of the tabular data.
ReplyDeleteCheers!
Sorry about that Ramiro. Thanks for the heads up. I just slimmed the workbook down below 5MB, so should be good now. Give the link another try and let me know if that helps.
DeleteBrent, works now. I have a follow up question for you somewhat related to this topic. I find myself not able to reason how to answer some basic questions using the DimDate, I wonder if I could implore upon your good nature to point me or post on the following ..
DeleteI have a simple table
ID Date Description Value
20130201 2/1/2013 SomeTransaction 8
20130201 2/1/2013 SomeTransaction 7
20130202 2/2/2013 SomeTransaction 5
20130203 2/3/2013 SomeTransaction 4
I also have a DateDim Table that looks very close to your date table that uses the ID as the foreign key.
The problem, assuming that the transaction table above has needs to be summarized into rolled up values of time. This part is easy, I can do quarters, months, trends etc..
Summary Table by Date
Date Sum of Values
Feb 1 15
Feb 2 5
Feb 3 4
The odd part of the sector I am in..
It’s very important to be able to show the min and max and delta b/w the min and max based on the time dimensionality.
Sample
i.e. picture a graph with a trend of the “Summary Table by Date”, + the following information tables somewhere on the report as information foot notes
Min Table
Date Value
Feb 3 4
Max Table
Date Value
Feb 1 15
Any help or guidance on the subject would be much appreciated. Reading materials, etc..
Cheers!